
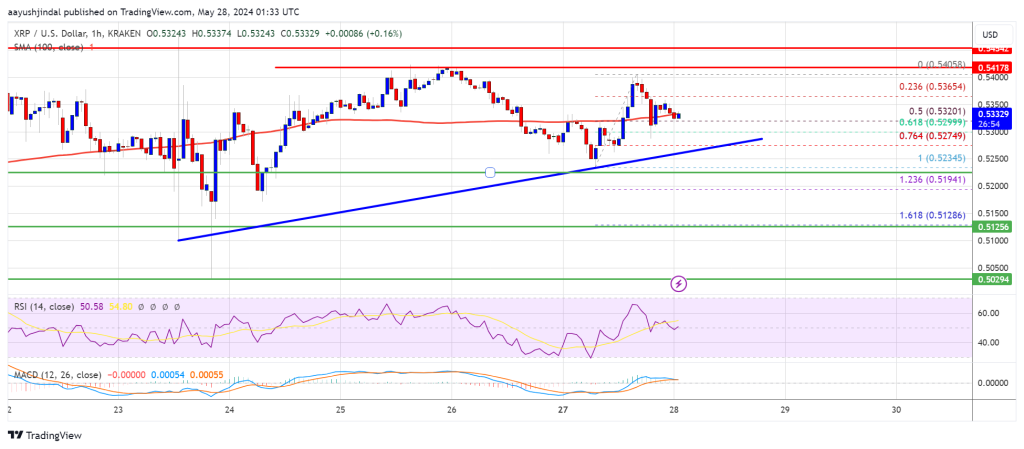
XRP price again struggled to continue higher above the $0.540 resistance. It is now consolidating near $0.5320 and might aim for an upside break.
In the past few sessions, XRP price traded in a positive zone like Bitcoin and Ethereum. However, the bears were active near the $0.540 and $0.5420 resistance levels.
The recent high was formed at $0.5405 and the price is now correcting gains in a range. There was a move below the $0.5340 support zone and the price spiked below the 50% Fib retracement level of the upward move from the $0.5234 swing low to the $0.5405 high.
However, the bulls are active near the $0.530 zone and the 61.8% Fib retracement level of the upward move from the $0.5234 swing low to the $0.5405 high. There is also a connecting bullish trend line forming with support near $0.5265 on the hourly chart of the XRP/USD pair.
The pair is now trading near $0.5320 and the 100-hourly Simple Moving Average. Immediate resistance is near the $0.5365 level. The first key resistance is near $0.5420. A close above the $0.5420 resistance zone could send the price higher. The next key resistance is near $0.5450.
If there is a close above the $0.5450 resistance level, there could be a steady increase toward the $0.5550 resistance. Any more gains might send the price toward the $0.5720 resistance.
If XRP fails to clear the $0.5420 resistance zone, it could continue to move down. Initial support on the downside is near the $0.5265 level and the trend line.
The next major support is at $0.520. If there is a downside break and a close below the $0.520 level, the price might gain bearish momentum. In the stated case, the price could decline and retest the $0.5120 support in the near term.
Technical Indicators
Hourly MACD - The MACD for XRP/USD is now losing pace in the bullish zone.
Hourly RSI (Relative Strength Index) - The RSI for XRP/USD is now above the 50 level.
Major Support Levels - $0.5300 and $0.5200.
Major Resistance Levels - $0.5365 and $0.5420.
An analyst has pointed out that Injective is forming a buy signal that previously led to 700% and 555% rallies for the asset’s price.
In a new post on X, analyst Ali Martinez has discussed a Tom Demark (TD) Sequential signal that has formed in the weekly price of Injective recently. The TD Sequential refers to an indicator in technical analysis (TA) generally used for spotting potential points of reversal in any asset’s price.
This indicator involves two phases: setup and countdown. In the first of this setup, candles of the same polarity (green/red) are counted up to nine. Once the nine candles are in, the price may have reached a turnaround point.
Naturally, the TD Sequential would suggest a probable bottom in the asset if the candles leading up to the setup’s completion were red. Similarly, the indicator would signal selling if the phase finished with an uptrend.
After the setup is done, the countdown phase begins. During this second phase, candles of the same type are again counted, this time till thirteen. After the thirteenth candle of the same polarity, the price may be assumed to have encountered another likely top or bottom.
According to Martinez, a TD Sequential signal of the former type has been completed for the Injective’s weekly price. Below is the chart shared by the analyst that reveals this recent signal in cryptocurrency.
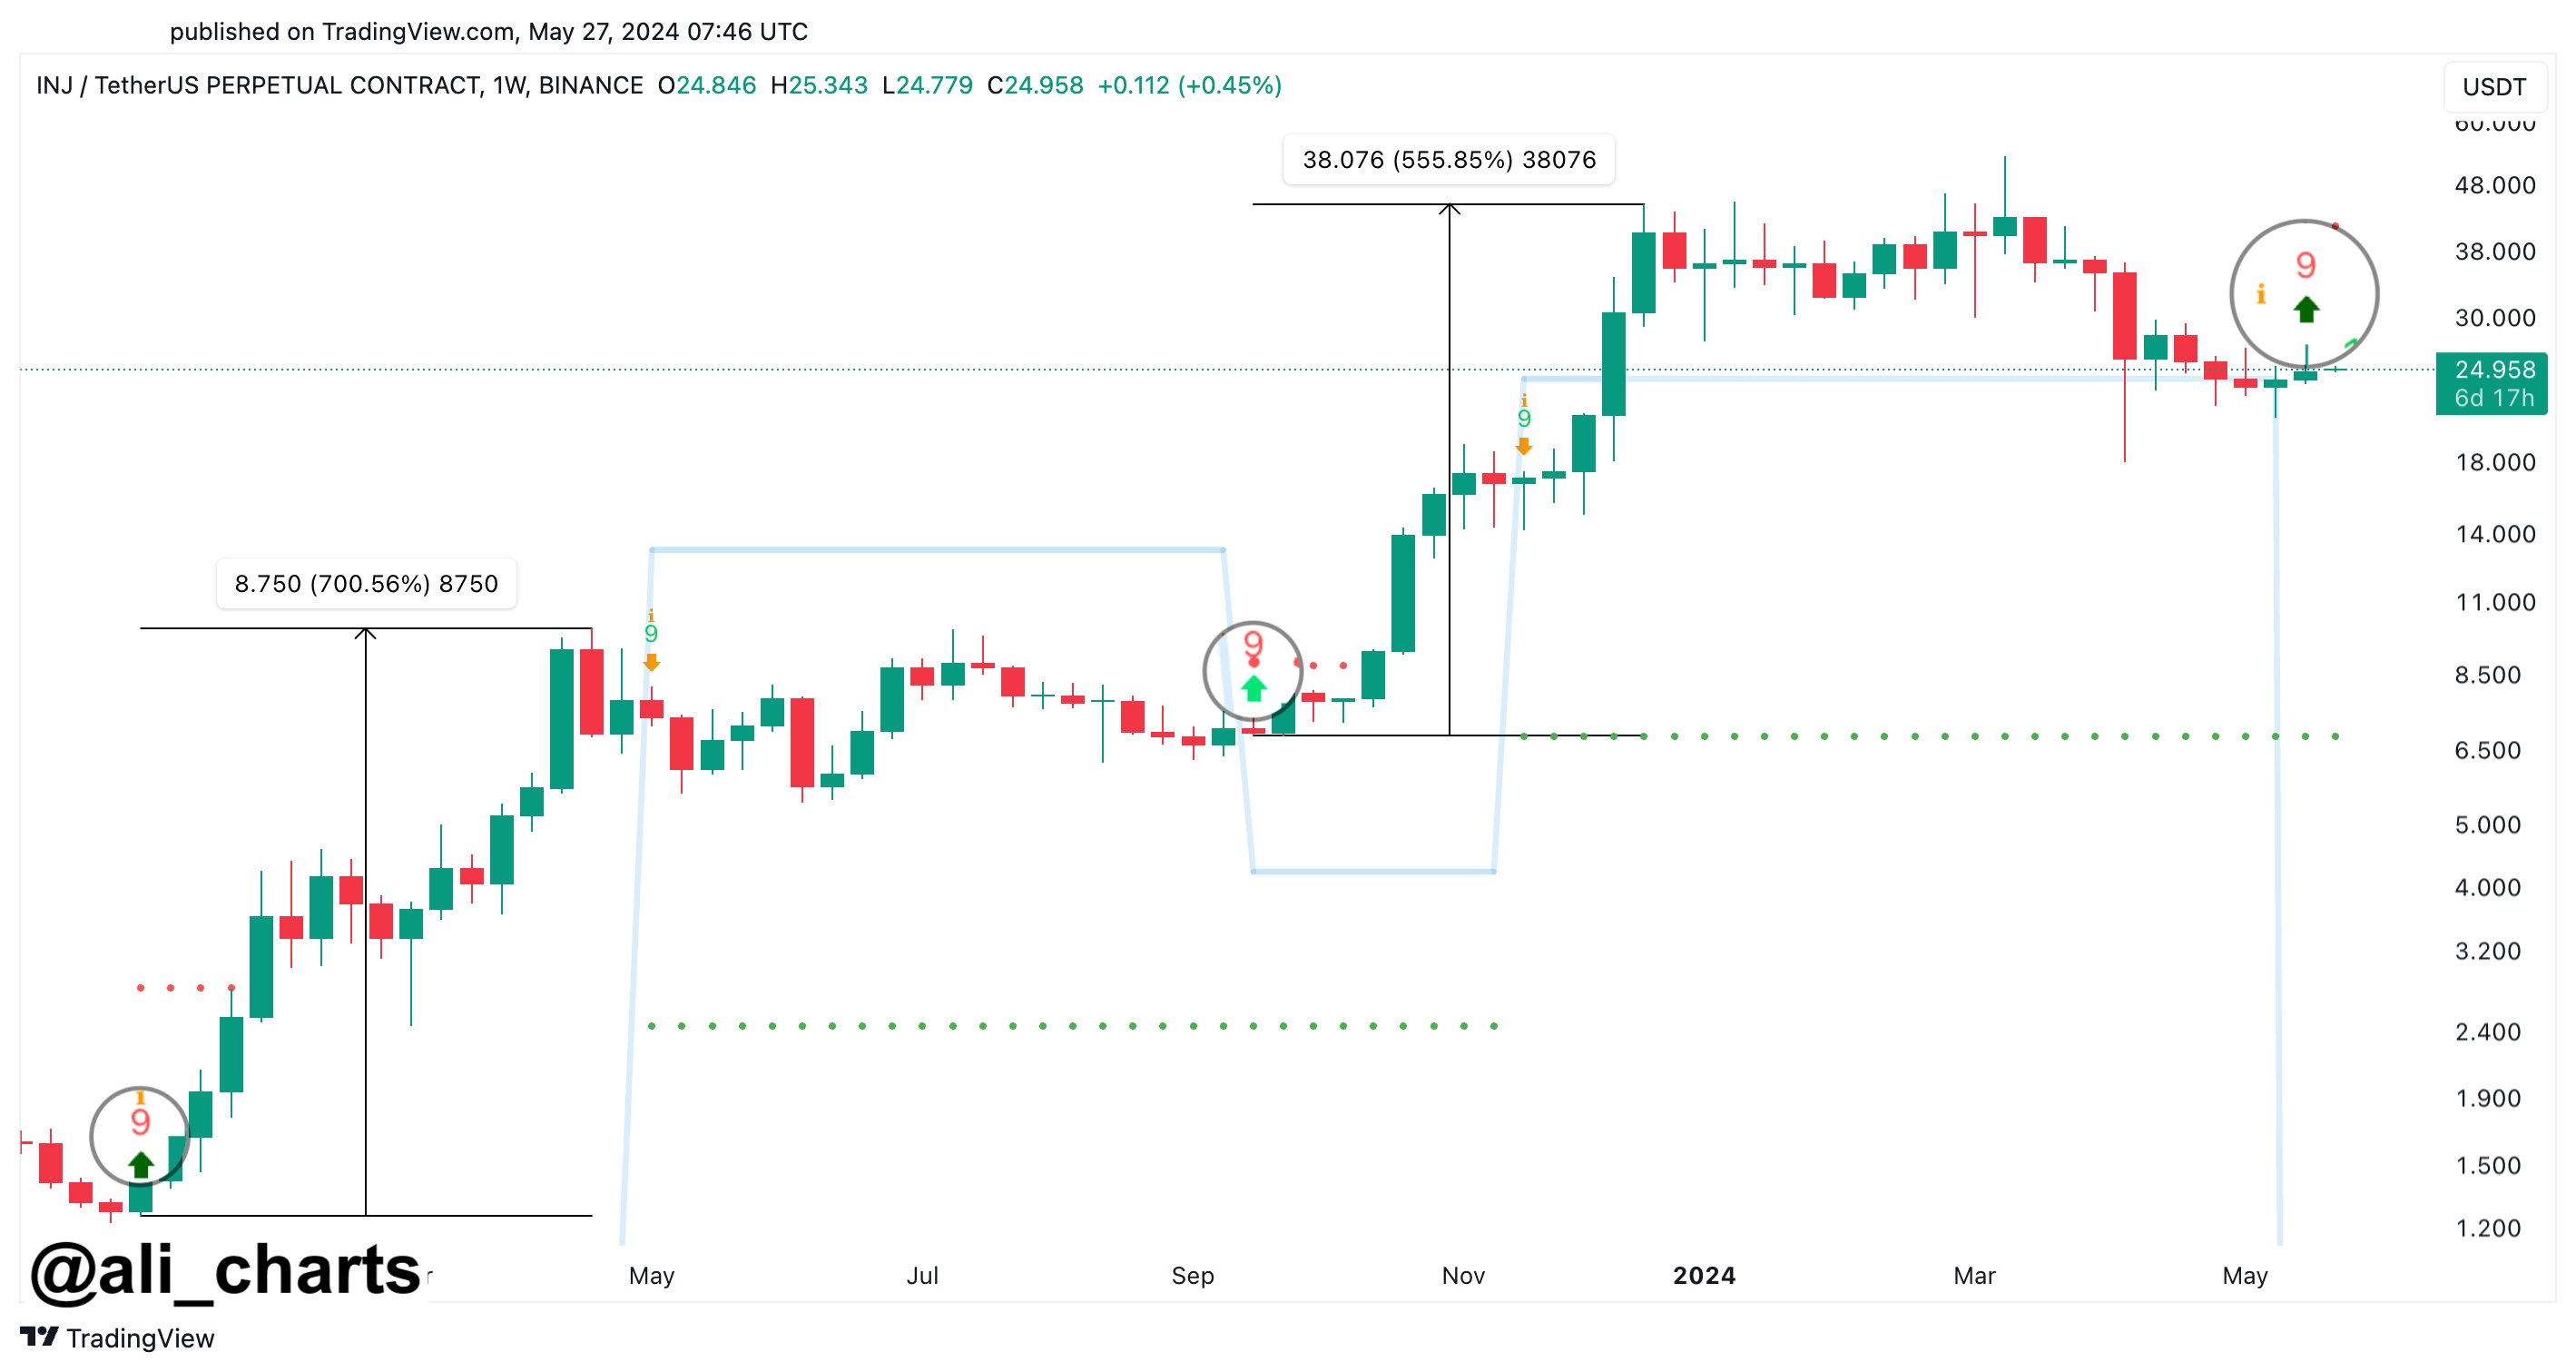
As the graph shows, Injective has finished a TD Sequential setup with a downtrend, suggesting that the asset may have reached a point of reversal towards the upside.
In the chart, the analyst has highlighted what happened the last two times the weekly price of the cryptocurrency encountered this signal. The first of these signals appeared to have preceded a rally of over 700%, while the other resulted in a surge of almost 556%.
Thus, given this bullish precedence, it’s possible that the latest TD Sequential buy signal could also lead to another run of sharp bullish momentum for the asset’s price.
However, it should be noted that the TD Sequential hasn’t always been completely reliable for the coin. As is visible in the graph, the indicator flagged a sell signal partway through the second of the rallies above.
As such, it remains to be seen how the Injective price develops from here on out and whether the TD Sequential buy signal will have an immediate bullish effect, just like it did the last two times.
The Injective has been stuck in consolidation over the past month. Its price is currently trading around $26, right in the middle of the range.
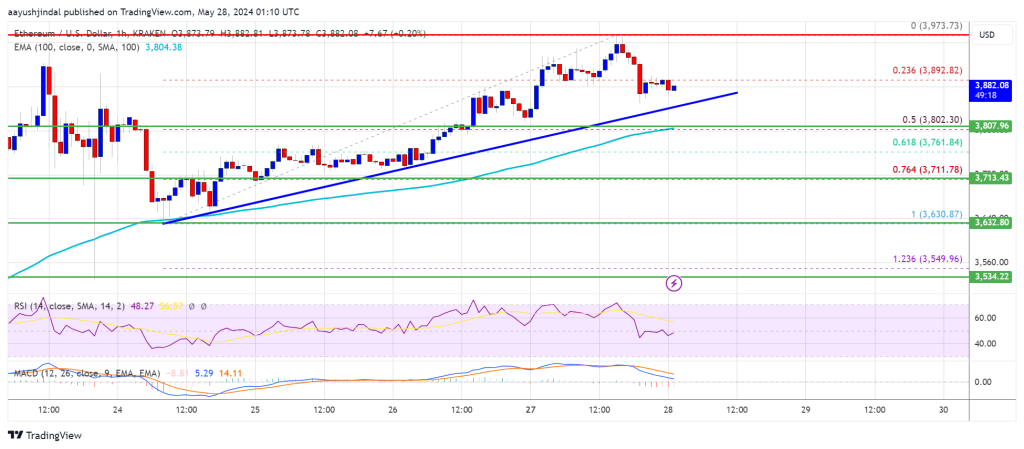
Ethereum price extended its increase above the $3,900 resistance. ETH is now consolidating near $3,880 and might continue to grind higher in the near term.
Ethereum price remained supported above the $3,650 support zone. ETH started another increase, outperformed Bitcoin, and climbed above the $3,750 level.
There was a move above the $3,850 resistance. The bulls pushed the price above the $3,940 resistance. It traded close to the $4,000 resistance. A high was formed near $3,973 and the price is now correcting gains. There was a minor decline below the $3,920 level.
The price dipped below the 23.6% Fib retracement level of the upward move from the $3,630 swing low to the $3,973 high. Ethereum price is trading above $3,850 and the 100-hourly Simple Moving Average. There is also a major bullish trend line forming with support at $3,860 on the hourly chart of ETH/USD.
Immediate resistance is near the $3,940 level. The first major resistance is near the $3,970 level. An upside break above the $3,970 resistance might send the price higher. The next key resistance sits at $4,000, above which the price might gain traction and rise toward the $4,080 level.
If there is a clear move above the $4,080 level, the price might rise and test the $4,220 resistance. Any more gains could send Ether toward the $4,350 resistance zone.
If Ethereum fails to clear the $3,940 resistance, it could continue to move down. Initial support on the downside is near the $3,860 level and the trend line.
The next major support is near the $3,800 zone or the 50% Fib retracement level of the upward move from the $3,630 swing low to the $3,973 high. A clear move below the $3,800 support might push the price toward $3,720. Any more losses might send the price toward the $3,630 level in the near term.
Technical Indicators
Hourly MACD - The MACD for ETH/USD is losing momentum in the bullish zone.
Hourly RSI – The RSI for ETH/USD is still above the 50 zone.
Major Support Level - $3,800
Major Resistance Level - $3,940
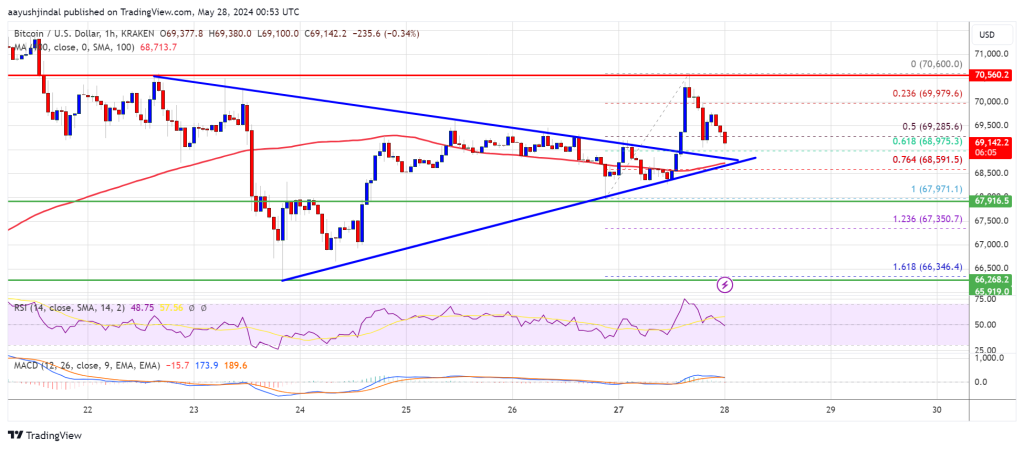
Bitcoin price climbed higher above the $70,000 level. BTC is now holding gains above support and might aim for another increase in the near term.
Bitcoin price started another increase from the $68,000 support zone. BTC cleared the $69,000 resistance to move further into a positive zone. There was a break above a key bearish trend line with resistance at $69,000 on the hourly chart of the BTC/USD pair.
The pair even climbed above the $70,000 resistance zone. A high was formed at $70,600 and the price recently corrected lower. There was a move below the $70,000 level. The price declined below the 50% Fib retracement level of the upward move from the $67,971 swing low to the $70,600 high.
However, the bulls are now active near the same trend line. They are protecting the 61.8% Fib retracement level of the upward move from the $67,971 swing low to the $70,600 high.
Bitcoin price is now trading above $69,000 and the 100 hourly Simple moving average. If there is a fresh increase, the price might face resistance near the $70,000 level. The first major resistance could be $70,600. The next key resistance could be $71,200.
A clear move above the $71,200 resistance might send the price higher. In the stated case, the price could rise and test the $72,000 resistance. Any more gains might send BTC toward the $73,200 resistance.
If Bitcoin fails to climb above the $70,600 resistance zone, it could continue to move down. Immediate support on the downside is near the $69,000 level.
The first major support is $68,500. The next support is now forming near $68,000. Any more losses might send the price toward the $66,500 support zone in the near term.
Technical indicators:
Hourly MACD - The MACD is now losing pace in the bullish zone.
Hourly RSI (Relative Strength Index) - The RSI for BTC/USD is now near the 50 level.
Major Support Levels - $69,000, followed by $68,500.
Major Resistance Levels - $70,000, and $70,600.
As Bitcoin navigates through a period of consolidation, the asset’s price movements are being monitored for optimal entry points. Michaël van de Poppe, a renowned crypto analyst, has recently shared valuable insights into Bitcoin’s current market status and potential for future movement.
According to van de Poppe, Bitcoin aims to stabilize within a particular price level, hinting at a possibly extended consolidation phase that could offer a clearer picture for strategic market entries.
Van de Poppe suggests specific price marks that could represent advantageous buying opportunities for Bitcoin. He points out that if Bitcoin’s price were to drop below $66,000, it could reach lower range levels, presenting a prime buying opportunity.
#Bitcoin aims to consolidate in these levels.
Where to buy?
Losing $66K and I think we’ll test range low and be buying there again.
That’s the level where you’d want to get your purchases ready. pic.twitter.com/RoYYzJJnt8
-- Michaël van de Poppe (@CryptoMichNL) May 27, 2024
Furthermore, in another post published on May 24, the analyst revealed that Bitcoin could slide towards $61,000, which could mark another significant entry point for investors. Monitoring these price levels could be key to capitalizing on potential market lows.
In addition to pinpointing optimal buying zones, Van de Poppe advocates adopting a Dollar-Cost Averaging (DCA) strategy during this period.
#Bitcoin is consolidating, and it’s within the range.
Probably that consolidation will be taking place for a longer period and I suspect we might see $61-63K even.
Rotation from Bitcoin to Ethereum causing a longer sideways period.
It’s fine. Simply DCA. pic.twitter.com/7hb77dNEKx
-- Michaël van de Poppe (@CryptoMichNL) May 24, 2024
This method involves making regular purchases of Bitcoin at fixed intervals, regardless of the fluctuating prices, thereby averaging the investment cost over time.
This strategy is particularly beneficial in mitigating the risks associated with BTC prices’ high volatility. It allows traders to build positions without the pressure of timing the market perfectly.
While van de Poppe focuses on immediate strategies for navigating the current Bitcoin climate, other analysts, like PlanB, look at broader market indicators to forecast future movements.
PlanB, known for its Bitcoin Stock-to-Flow model, observes that the Market Value to Realized Value (MVRV) score and Bitcoin's Relative Strength Index (RSI) show signs of a potential surge.
Bitcoin is gaining momentum pic.twitter.com/tbQu7o0hDB
-- PlanB (@100trillionUSD) May 26, 2024
Historical data suggests that rising MVRV scores, alongside increasing RSI, often precede market tops and heightened buying activity.
Moreover, PlanB's recent analysis indicates that the periods with low MVRV scores, which typically correspond with bearish market phases, might be cycling out, hinting at upcoming bullish momentum.
This could mean that, despite the recent high of $71,000, Bitcoin might not only revisit these levels but could potentially exceed them, challenging its all-time high of $73,000 set in March.
Featured image created with DALL·E, Chart from TradingView
The XRP price saw some recovery over the weekend, and has continued to maintain some of this bullish momentum. However, it seems experts do not expect the altcoin to continue its bullish trend, with one crypto analyst predicting that the XRP price is headed for a massive crash.
A crypto analyst who goes by the moniker Without Worries on the TradingView website has shared a concerning development for the XRP price. This analysis ,which focuses on the altcoin's performance over the last two years, suggests that the price is more likely to crash from here than continue its climb.
According to the crypto analyst, the XRP price had been trading inside an uptrend channel for the last two years. Mostly, this channel has held up, allowing the cryptocurrency to hold onto its bullish trend. However, the analyst explains that this uptrend channel support has now failed, and with the confirmation complete, it points to a price reversal for the altcoin.
Furthermore, the crypto analyst points out that this channel support failure came after a could top in the price after the coin broke market structure back in April 2022. Given this, he expects the price to reverse from here and crash to levels not seen since 2020.
The target for this crash sits at the $0.1, according to the analyst. If this happens, it would mean an over 80% crash from the current value of the token, which sits at around $0.5, at the time of this writing.
Like with any analysis, the crypto analyst explains that there is a scenario in which the XRP price could continue its present uptrend. In such a case, the price would have to continue trading inside the channel and hold its support at this level.
However, he explains that the price action has already exited the channel. Now, the point to hold becomes the $0.3 level. As long as this holds, then the uptrend would continue. "that support not confirm, 10 cents is next," the analyst explains.
The analyst believes it is possible that the price action does enter the channel and continue to uptrend. However, he points out that this is not probable, given that there is already confirmation of the price failing to hold support.
Nevertheless, at the time of writing, the XRP price is still holding above $0.52 with 1.33% losses in the last day. But it is seeing small gains go 2.82% in the last week and remains the 7th-largest cryptocurrency in the space with a market cap of $29.3 billion.
Since trading firms like FTX collapsed in November 2022, the Solana blockchain has seen significant gains and regained investor confidence, with Ethereum developers increasingly migrating to it.
According to a recent analysis by Jack Inabinet, Senior Analyst at Bankless, with significant growth in key metrics and SOL’s year-to-date increase of 770%, Solana has solidified its position as a top-tier blockchain. Native teams within the Solana ecosystem played a key role in its resurgence, but now non-native protocols are also seizing the opportunity.
Solana’s comeback, from a low of $8 in December 2022 to an annual high of $210 in March, is one of the most notable uptrends of this bull cycle. However, the ecosystem’s growth extends beyond its native token holders.
According to Inabinet, developers have delivered on the hype, starting with the PYTH airdrop, the Pyth network’s native token. This incentivized users from different ecosystems to explore SOL by assigning tokens to addresses interacting with Pyth oracles across multiple networks.
Additionally, Solana-native liquid staking protocol Jito Labs conducted its airdrop, catalyzing "mass adoption" through points-based incentive systems.
While Solana-native protocols laid the foundation for the platform’s mainstream adoption, Ethereum developers are increasingly migrating to SOL. Inabinet highlights that recognizing the significant on-chain activity within Solana, projects are eager to capitalize on the opportunity.
For example, the decentralized compute-sharing network Render migrated its token to the Solana Program Library (SPL) standard, and MetaMask introduced Solana compatibility by introducing “Snaps.”
In addition, according to Inabinet, Aave, Ethereum’s first lending destination, has approved the deployment of a minimally viable version of its V3 isolated money market through Neon Ethereum Virtual Machine (EVM), a compatible Ethereum development environment built on top of Solana.
Proposals for independent deployments, such as the EVM-based perpetual trading platform GMX, further demonstrate the growing interest in SOL.
However, the analyst noted that Ethereum and Solana have different approaches to scaling, with Ethereum opting for network fragmentation and Solana favoring a unified state.
Given these approaches, Inabinet suggests that Solana’s alternative vision of blockchain offers attractive features, attracting developers seeking scalability and concentration of use.
Nonetheless, the analyst cautions that developers must take a diversified approach to maximize success and secure market share. Inabinet concluded:
The crypto industry must hurdle a massive chasm of uncertainty to progress from infancy into an end-state where true adoption is achieved, and trillions upon trillions of dollars in traditional assets make their way on-chain. Until then, application developers succumbing to blind chain loyalty are leaving money and market share on the table.
As of press time, SOL has seen a 5% increase in the last 24 hours, resulting in a current trading price of $171, with the next price hurdle at $176.
Featured image from Shutterstock, chart from TradingView.com
